🚅From Dot Matrix to Dashboard | The Timeless Art of Reporting🖨️
The Evolution from Dot Matrix Printers to Modern Dashboards | Why the Message Remains Crucial
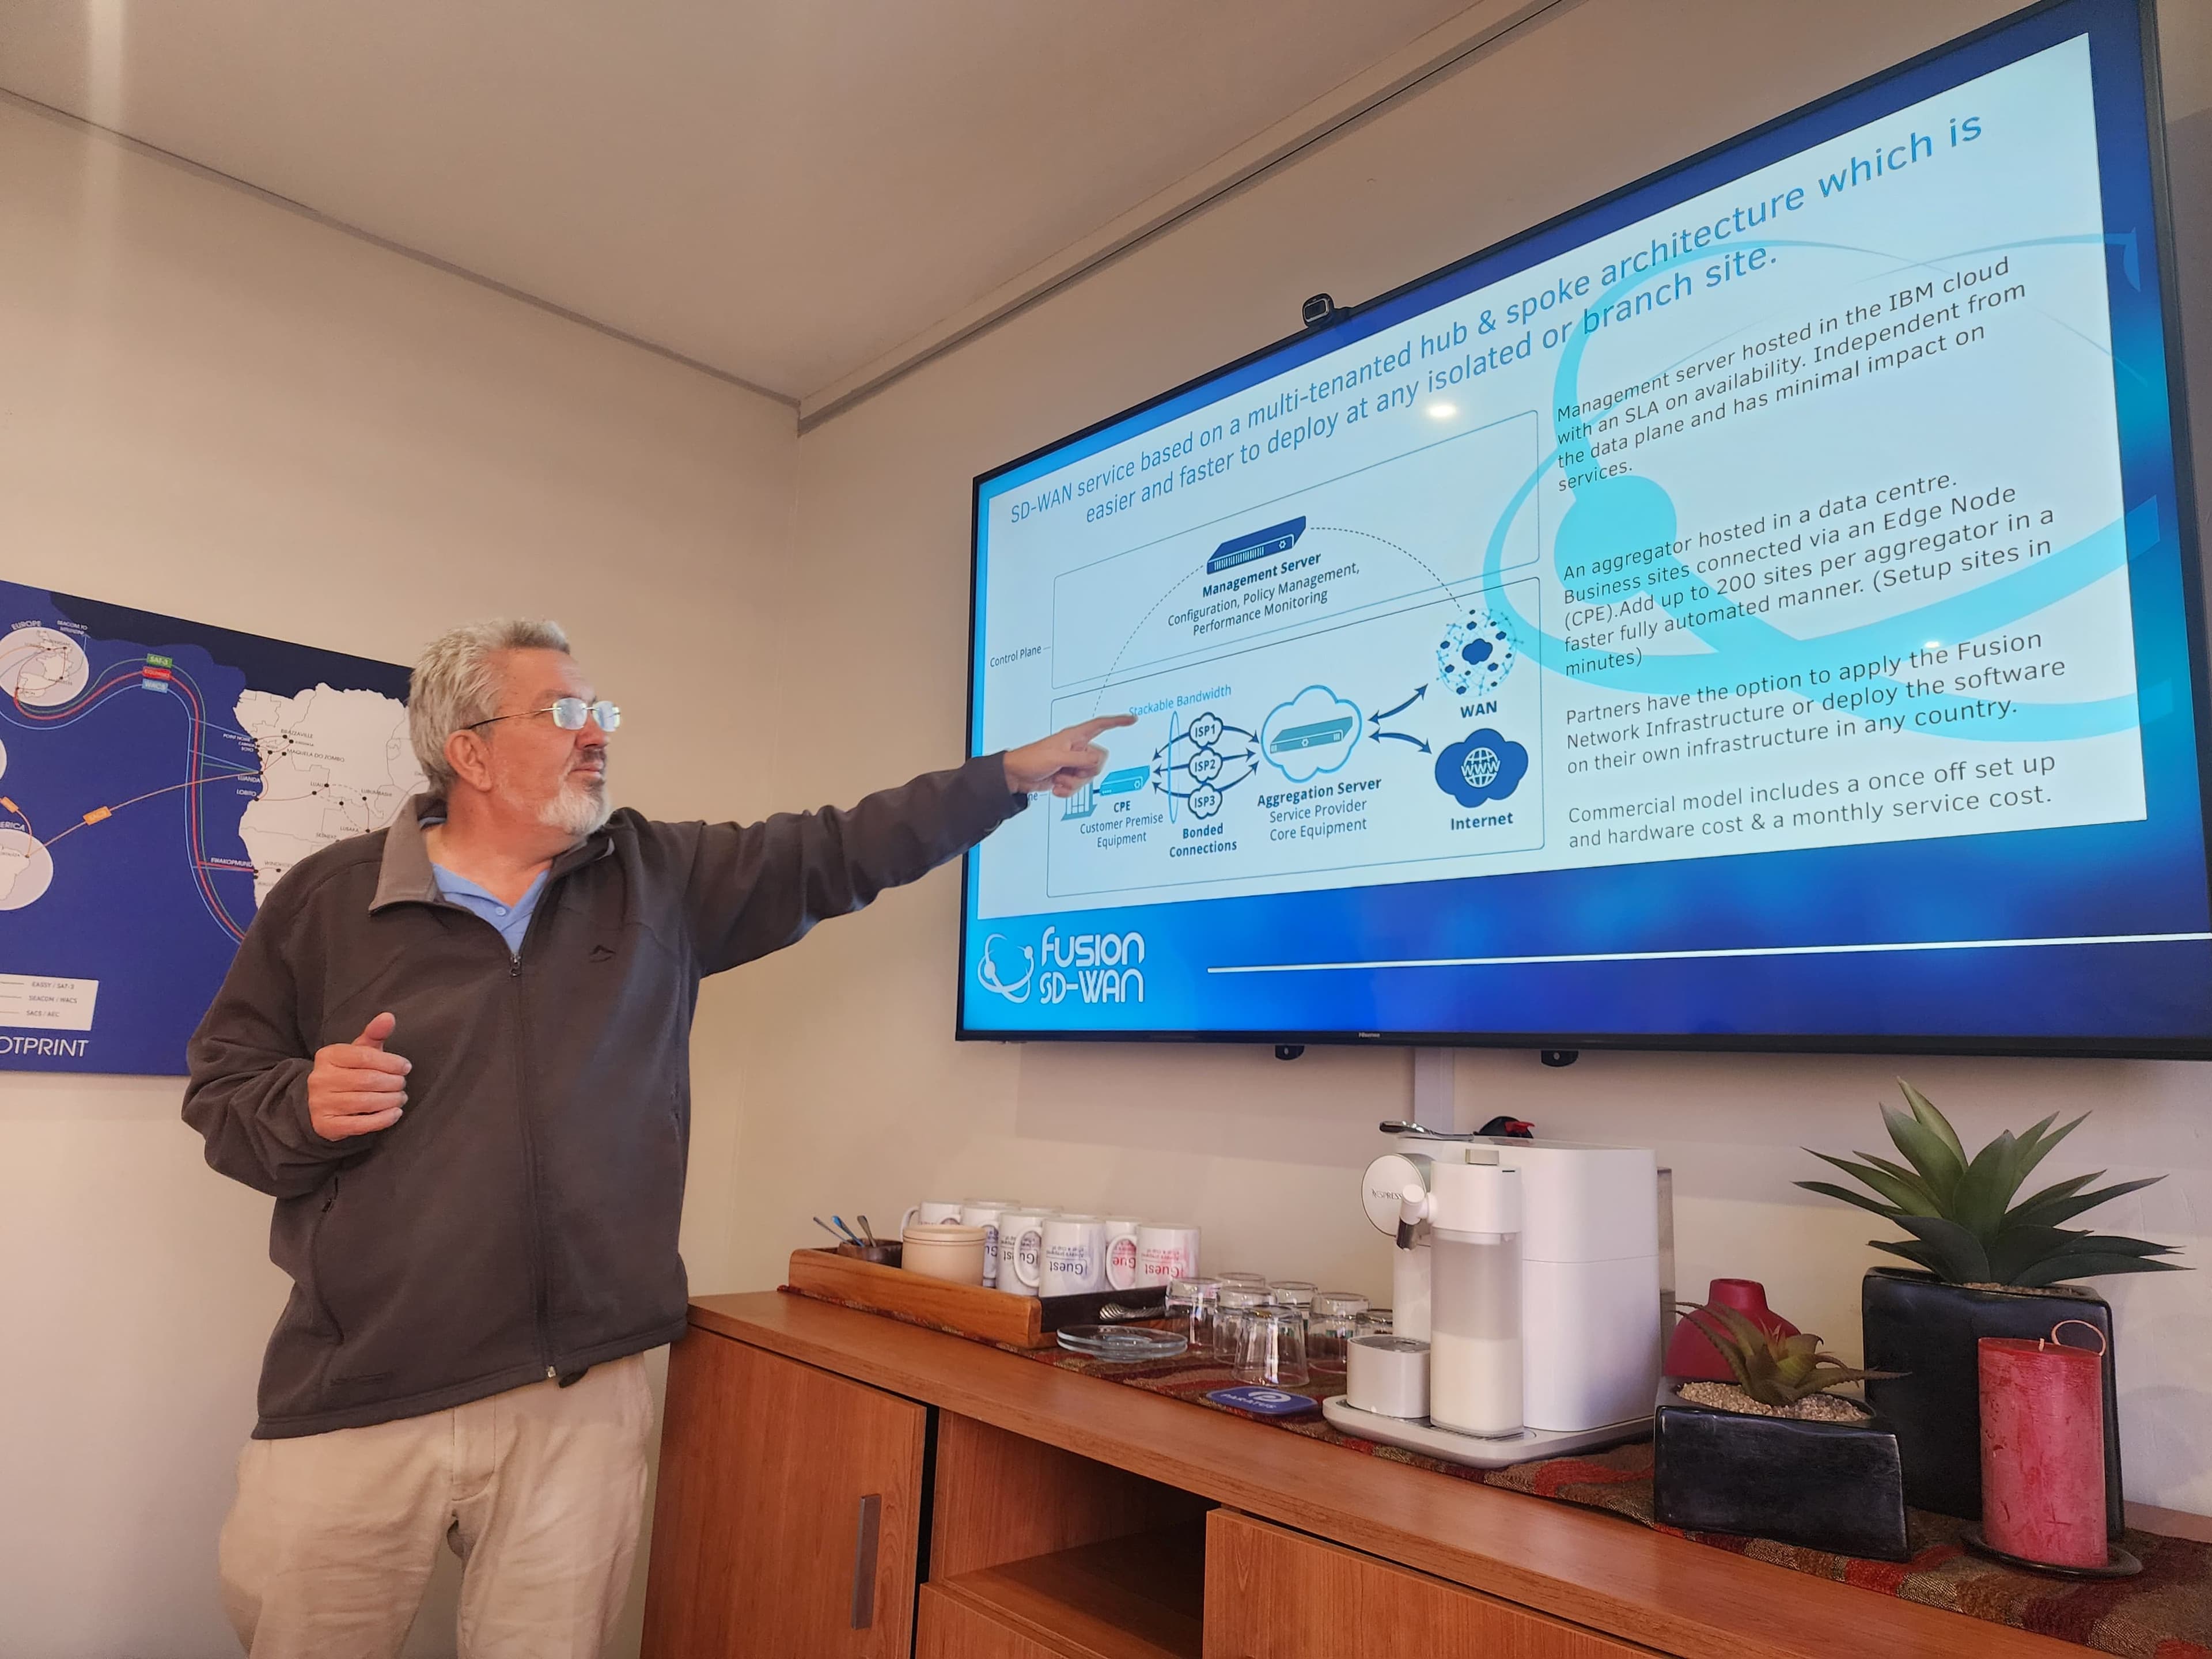
Driving SD-WAN Adoption in South Africa
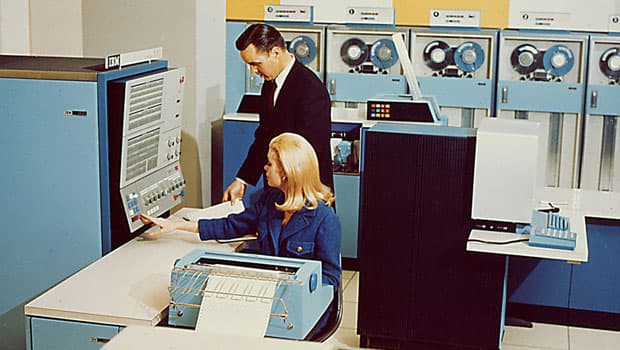
Back in 1991, the buzz of dot matrix printers filled the air, churning out reports that, while simple in appearance, carried the weight of vital business insights. Today, those noisy printers have been replaced by sleek flat-screen monitors displaying fancy dashboards, yet the essence of what these reports deliver remains unchanged. It’s not the medium, but the message, that matters.
My journey into the world of technology began at the Railways, where I cut my teeth on COBOL programs and DB2 databases. It was a time when discrimination wasn't just an ugly word—it was a reality. I experienced it firsthand when I was denied access to the railway pension fund because of my disability. Rather than fight the injustice, I chose to move on, finding a new home at Network Interface Consultants, a small networking company founded by Andre Maree.
The Humble Beginnings | Top 20 Reports
In my early days at the Railways, I was tasked with developing Management Information System (MIS) reports—something the team had struggled with for years. The requests seemed straightforward enough:
Top 20 senders of goods per station
Top 20 receivers of goods per station
Consolidated Top 20 senders and receivers per station
Top 20 types of goods sent and received per station
And a 21st category, neatly aggregating everything else as "other"
These reports, printed on dot matrix paper, were a critical resource for decision-makers, providing clarity and insight into the operations of an enormous transportation network. They were crude by today's standards, but they got the job done.
The Agony and Ecstasy of Programming
It wasn’t all smooth sailing. One of my runs had a logical error that led to a 23-hour processing time and a whopping R250k bill—an unforgettable lesson in the importance of precision. However, through trial and error, I eventually delivered the program.
The requests kept coming: “Could you produce these reports by financial value, not just count?” They wanted branch-level reporting, grouping stations by branch line number. That one took me a month to perfect due to a stubborn programming error I couldn’t spot until I walked someone else through my code.
Years later, I found myself in a remote railway office, and there, on the table, were those very reports. It was a proud moment to see that my work had stood the test of time.
The Anomalies
These reports picked up an interesting anomaly where a small branch station would have a large transaction. When reviewing these transactions it was apparent that waybills were being used with incorrect information. The system prevented blank waybills being used by the stations masters had realized they could achieve the same by just filling in all the fields with the letter 9. There was no data validation so the next release of the billing software included date validation.
Strangely enough, 10 years later a programmer phoned me about a “bug” in the code. The billing system stopped accepted dates from 1 January 2000. It was claimed to be a Y2K bug. Never mind that consultants were paid millions to validate the systems at the Railways, none looked at the validation process but only the storage component of the date. The fix was a setting change in the parameters in change the date range validation.
Lessons Learned
The Power of Experience: You don’t truly understand discrimination until you've faced it yourself.
Simplicity is Key: Despite handling 12 million shipments per year, the most important insights boiled down to a Top 20 list. People care about what directly affects their logistical and financial concerns.
Fresh Eyes Matter: When stuck, sometimes all you need is to explain your problem to someone else. The solution may suddenly appear, as it did for me.
Longevity of Technology: Despite the rapid pace of technological change, some solutions—like my railway reports—remain relevant far longer than expected.
The Modern Parallel | Network Traffic Analytics
Fast forward to today, and the reports businesses need haven’t really changed—they’ve just migrated from dot matrix printers to dashboards on flat screens. In modern networks, the data we analyze mirrors those old railway reports:
Shipping Transactions = Network Flow Data
Senders and Receivers = IP Addresses
Goods = Application Types
Stations = Routers
Branches = Groups of Locations or Regions
However, while many network flow applications report on counts, few consider financial value—a critical dimension for understanding the true impact of network traffic on business operations.
Illuminate Advanced Traffic Analytics | The Modern Solution
This is where Illuminate Advanced Traffic Analytics from Fusion comes into play. Illuminate isn’t just another network monitoring tool—it’s the evolved version of those old railway reports, adapted for the digital age. It can track not only the volume and types of network traffic but also their financial impact. Just as those dot matrix reports guided railway operations, Illuminate provides businesses with the clarity and insight they need to manage their networks effectively.
Illuminate’s ability to consolidate and analyze vast amounts of data—much like those Top 20 reports—makes it indispensable for modern enterprises. Whether you're tracking IP addresses, application types, or regional traffic, Illuminate delivers the precise insights needed to keep your business running smoothly.
Wrap | Reports Then and Now
In the end, the reports printed on dot matrix printers back in 1991 and today’s dashboards on flat-screen monitors aren’t so different after all. They both serve the same purpose: turning raw data into actionable insights. And while technology may have evolved, the principles of effective reporting remain timeless. Just as my old railway reports kept trains on track, today’s advanced analytics tools like Illuminate keep businesses moving forward.
So next time you’re staring at a fancy dashboard, remember that it’s not just the pixels on the screen that matter—it’s the quality of the information behind them.
Ronald Bartels ensures that Internet inhabiting things are connected reliably online at Fusion Broadband South Africa - the leading specialized SD-WAN provider in South Africa. Learn more about the best SD-WAN provider in the world! 👉 Contact Fusion